
Interference Hunting
Interference hunting requires the ability to spot, find and fix a known interferer which is not always an easy task. Not only having the right tools, but the ability to properly identify the issue is key to interference hunting. The first step in solving an interference issue is actually determining that there really is interference. Sometimes there are other issues at play that cause a communications system to work less than optimally but don’t actually involve an outside signal.
What is Interference?
Interference is any unwanted signal that makes a radio receiver’s job harder such as illegal transmissions, unlocked and drifting transmissions, noise from leaky cable TV feeds, unsuppressed EMI from power tools or microwave ovens, local high power radios and even multi-path from nearby buildings and hills. Interference from both illegal and unintentional signals is a significant problem for mobile service providers, security services and government regulators. Interference degrades network performance, causing critical communications to be interrupted.
Sources of Interference
- Illegal jammers
- Unlocked or drifting radios
- Oscillating repeaters
- Damaged or leaking RF cables
- Improper antenna positioning
- Pulsed signals (similar to radar)
- Signals hidden in LTE uplink channels
- “Pirate” TV/radio stations and BTS cellular equipment operating illegally
Benefits of Real-time Spectrum Analysis for Resolving Interference Problems
RF field engineers have relied on spectrum analyzers to detect transient interferers and unwanted hidden signals for each wireless communications generation. As we enter a new era where millimeter wave (mmWave) frequencies are becoming more commonplace due to the rollout of 5G and advanced aerospace/military systems, selecting the proper spectrum analyzer becomes more important. In fact, it can be the difference between quickly and efficiently locating and removing an interfering signal or missing it entirely and having network performance fail to meet key performance indicators (KPIs).
Many modern spectrum analyzers can perform the following functions — real-time spectrum analysis (RTSA), swept-tuning and signal analysis. Each has advantages and limitations for interference hunting.
Advantages of Real Time Spectrum Analyzers
RTSA’s continuously acquires samples of pulsed or transient signals where a fast Fourier Transform (FFT) is performed. RTSA’s are particularly useful for finding intermittent interference signals.
The RTSA process flow can acquire a new sample frame while simultaneously performing the FFT on the previous sample frame. This parallel processing requires fast digital hardware and a large memory buffer. RTSA spectrum analyzers perform FFTs at an extremely fast rate. For example, the Field Master Pro™ MS2090A, can perform 527,000 FFTs per second for a 512-point FFT.
Most RTSA instruments display the FFT data in a colorful density display, which summarizes the amount of time RF energy is present at any given frequency/amplitude during the capture. This is especially useful in interference analysis for two reasons. First, signals of very short duration will still be displayed on the screen. Second, when an interfering signal is hidden inside an intended modulated signal, it will still be displayed on screen. Often, these signals will be shown in a different color for easy recognition.
Swept-tuned Spectrum Analyzer
A swept-tuned spectrum analyzer uses an architecture that sweeps its local oscillator (LO) to down-convert the input frequency range to a fixed intermediate frequency (IF). It is then filtered by the resolution bandwidth (RBW) filter and detected. This type of spectrum analyzer can only see a small portion of the frequency span at any moment. It is blind to transient signals that appear when the sweep is scanning a different part of the input frequency range. Wideband monitoring is often most useful in the detection phase of the interference mitigation process.
Signal Analysis Process
To determine the type of interference under investigation, the signal can be demodulated. Various parameters such as signal quality, color codes and identification information (depending on signal type) can be obtain. Knowledge of the signal type can ofter help the user in addressing the interference problem. Where signal identity can be determined, the problem can sometimes be address with a phone call to the offending party.
Probability of Intercept (POI)
The key performance metric when evaluating spectrum analyzers, especially for finding transient interference, is the probability of intercept (POI). POI is defined as the minimum signal duration necessary to accurately measure the amplitude of a continuous wave (CW) signal. The smaller the POI, the higher the chance of catching intermittent interference.
POI is affected by several factors, including FFT processing speed, sample rate, window overlap, RBW, and span. Let’s examine a few of these considerations.
RTSA Background
Given its ability to perform real-time analysis coupled with wideband monitoring and signal analysis, the MS2090A Field Master Pro provides the ideal solution for interference mitigation. With an optional 110 MHz real-time bandwidth and 100% probability-of-intercept (POI) for signals down to 2.05 µs duration, the MS2090A handles a diverse array of potential interference types varying in complexity and signal duration. Various features to consider for a spectrum analyzer with real-time analysis capability are described below.
Windowing
When a sample block is acquired for FFT analysis, the mathematics of the FFT presumes the time domain signal is periodic with a segment equal to the sample frame duration. The samples at the beginning and end of the sample frame create an unwanted discontinuity in the time domain. The frequency domain energy is spread out, rather than concentrated at the original sine wave’s frequency.
Spectral leakage is undesirable in FFT spectrum analysis because the ability to resolve closely spaced frequency components with different amplitude levels is lost. Signal amplitude is no longer an accurate representation of the true signal level because the spectrum energy has spread out.
To eliminate these effects, the segments in the sample frame are multiplied by a window function that smoothly tapers them near the start and end of the frame to zero. Thus, when these modified samples are presented for FFT analysis, the periodic extension does not have a sharp discontinuity and the spectrum leakage is reduced.
RBW and Span Interdependence
Windowing also serves to implement the RBW filter in FFT spectrum analysis. Performing FFT analysis on the windowed samples causes a bandpass filter response to appear around any frequency components captured within the FFT analysis bandwidth. Figure 7 shows the FFT spectrum for an input consisting of multiple CW signals that are spaced apart in frequency by one RBW. With just one capture, the FFT effectively applies a bank of parallel RBW filters to the input signal. Notice that the RBW filter response is incomplete at frequencies near the start and stop of the FFT span. Because of this, the usable bandwidth is only about 80% of the full analysis bandwidth of the FFT, which is equal to the FFT input I/Q sample rate (Fs).
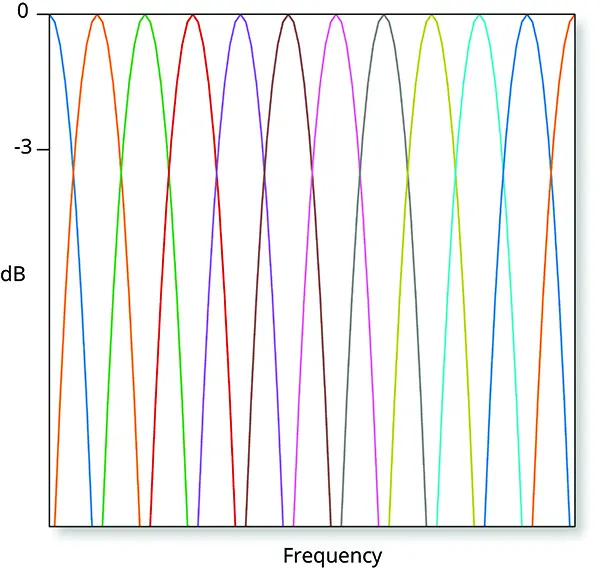
FFT analysis with windowing effectively forms a bank of parallel RBW filters. The figure shows the frequency spectrum for multiple CW signal inputs with a frequency spacing equal to one RBW
Window Overlap
Since windowing tapers the time samples at the beginning and end of the sample frame to zero, transient signal events at the edges are lost. Overlapping is used to ensure the capture of these signal events. Each sample frame for the FFT is partially filled with samples that were captured in the previous frame.
For total amplitude accuracy, the signal must occupy the entire area under the window function. Meeting this condition will ensure that at least one sample frame and its FFT will capture the full signal amplitude since the start of the signal event can occur at any time relative to the start of any sample frame.
If FFT analysis is performed using overlapping sample frames, the required signal duration for 100% POI is shorter. If the window length is smaller than the FFT size, the required signal duration will be shorter, thereby improving POI. A wider RBW corresponds to shorter window length and shorter POI.
Density Display Resolution
Selecting the appropriate point FFT size depends on the situation. A 512 point FFT size allows for the lowest POI, however the FFT frequency bin resolution is coarser and can cause the display to appear more granular at low RBW settings. The 1024 point FFT size allows a smaller RBW setting for a given span with less display granularity at the cost of a higher POI.
Because a 512 point FFT updates 527,000 times per second, it can show the measurement results in a more meaningful way than an LCD display. A density display shows the color graded intensity of a signal event. The warmer the color, the more frequent the signal event. The density display also can simultaneously show up to six spectrum traces, which represent the detection result for all the FFTs calculated during the acquisition interval.
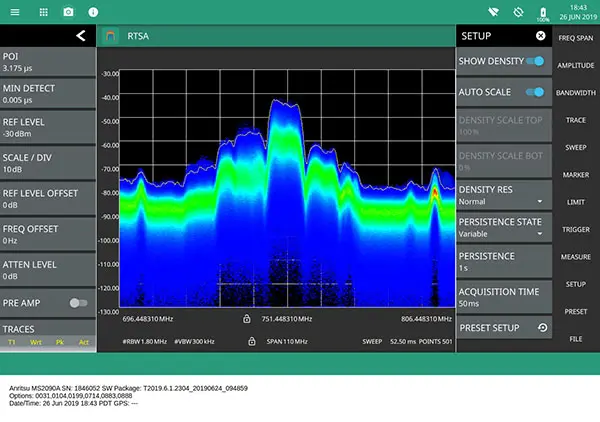
Density display resolution set to normal. FFT = 512 points. Minimum RBW limited to 1.8 MHz.
Request a demo today
See how the MS2090 can help you identify interference sources. Complete your name and email address below and we will contact you to arrange a demo.
MS2090A Field Master Pro
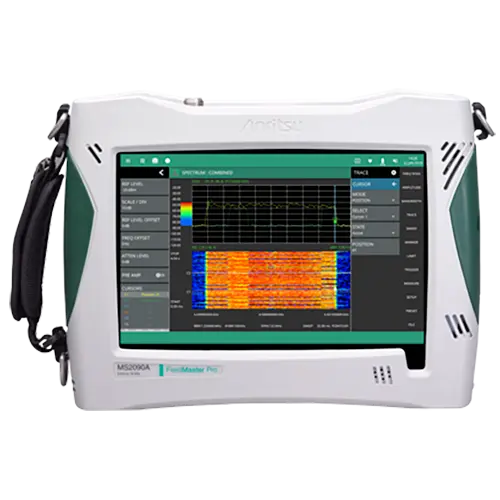
Handheld Spectrum Analyser delivering the highest continuous frequency coverage and real-time spectrum analysis bandwidth up to 100 MHz.
For interference hunting the fast sweep speeds, low distortion front-end, and spectrogram display help deploy new network efficiently, ensuring spectrums are clear and validating that all legacy users have stopped all transmission.